Low Expectations
By Mitch Berg
Democrats are fond of trying to find statistics that try to show that the Obama Administration has not been a complete economic disaster.
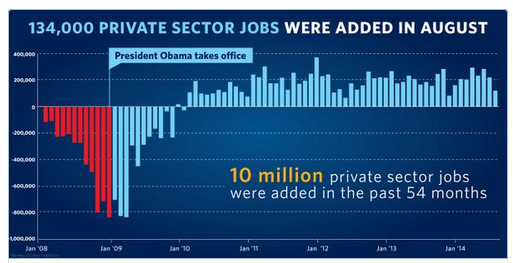
One way is via a blizzard of charts that claim to show a long series of months with job growth:
“It’s Bush’s fault! It’s Bush’s fault!”
Of course, as Mark Twain once said – and it’s a cliche I almost regret to say – but there are three types of data; lies, damned lies, and statistics put out to defend Democrat economic policy.
A graph will look very, very different, and depict very different things, depending on the two dimensions you select, as Philip Bump points out in the Wall Street Journal.
Obama looks best when you compare his job creation record with the day he took office – a graph which, by the way, has some liberals chortling, in that it makes Jimmy Carter look like a boss job creator:

Of course, Clinton is the champ – he’s the only two-term president since World War II that didn’t have a recession on his watch – thanks, of course, to Ronald Reagan and the Peace Dividend, as well as Newt Gingrich stifling the worst of Bill and especially Hillary’s agenda. Clinton was a champ in spite of himself, and largely due to his opposition.
We also note that more jobs were created on Dubya’s watch in three years than in six and a half of Obama; remember, Dubya had the 9/11 recession and the housing bubble in his eight years.
But isn’t comparing job growth versus a president’s first day in office a little artificial?
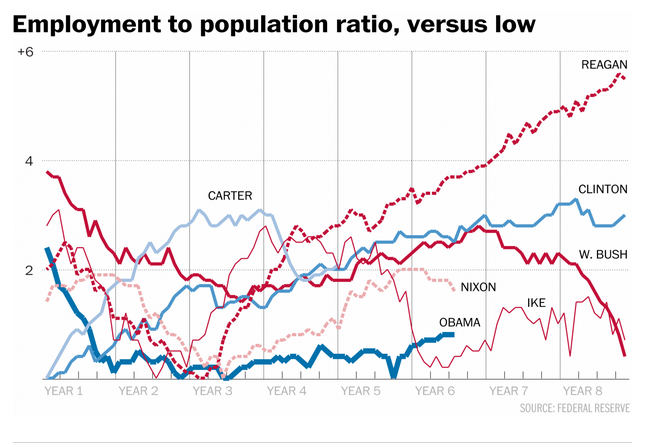
Sure. Let’s compare presidents with their administration’s low points:

So in other words, Obama’s like Nixon. I wasn’t very old at the end of the Nixon administration, but we all know what a lousy time that was.
But of course, the population has changed; Reagan added 17 million jobs in a population that was around 260 million. Obama has added nine million jobs in a nation of 315 million (although nobody’s really counting anymore). So how about we measure this in terms of concrete percentages?
As anyone who was looking for work back then knows, life under Reagan was infinitely better; the economy added a higher percentage of jobs in the quarter after the end of the’82 recession than it has in the six years of the Obama recovery.
Print out that last graph. Share it with your liberal friends.


October 1st, 2015 at 1:42 pm
Bush looks bad anyway you look at it.
October 1st, 2015 at 2:58 pm
If you include number of illegals, which mushroomed during 0bumbler’s rule, to the denominator, that ratio is much worse.
October 1st, 2015 at 10:18 pm
DMA on October 1, 2015 at 1:42 pm said:
Bush looks bad anyway you look at it.
Everyone who endorses the economic policies of G.W. Bush, raise your hand.
What? No one? Bueller?
October 2nd, 2015 at 10:00 pm
“The public sector grew during Mr. Carter’s term (up 1,304,000), during Mr. Reagan’s terms (up 1,414,000), during Mr. G.H.W. Bush’s term (up 1,127,000), during Mr. Clinton’s terms (up 1,934,000), and during Mr. G.W. Bush’s terms (up 1,744,000 jobs).
However the public sector has declined significantly since Mr. Obama took office (down 550,000 jobs). These job losses have mostly been at the state and local level, but more recently at the Federal level. This has been a significant drag on overall employment.”
http://4.bp.blogspot.com/-ijrOKEVTr7g/Vg7k3i9JAzI/AAAAAAAAlME/BNsIhtWic8U/s1600/PublicSept2015.PNG