The BLS numbers for January came out last Friday. And they showed what pretty much everyone expected them to show after the holiday and the election wore off; the economy still sucks.
The headline story is that unemployment crept up again, to 7.9%, after dropping (putatively) to 7.7% in November.
But in my book the real story is this; even with the top-line unemployment number under 8%, the work force participation rate is stuck at 63.6%, right where it’s been for three months after blipping above and below that figure for most of the past year.
Which means when you take the 7.9% unemployment rate out of that low labor force participation rate, you get 58.58% of the workforce actually working.
That compares to: 60.58% – exactly two points higher – when Obama took office (with an unemployment rate of 7.8%). That translates to six million fewer people working in the labor force now, even with an unemployment rate that’s supposedly nearly the same. Or to 58.50% in October 2009, when unemployment peaked at 10%.
That’s right; even with the unemployment rate supposedly two points lower than the recessions nadir, the actual portion of the population working is nearly unchanged.
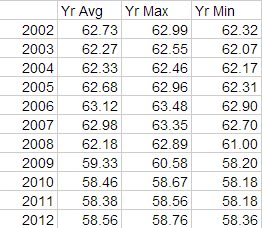
And to show how in-set this recession is? Here’s a list of
As you can see, the average of monthly employment rates (after taking the unemployed out of the participating labor force) is lower than it was when the recession supposedly bottomed out.
This isn’t a recovery. This is an extended coma, with neither improvement nor much deterioration beyond the already awful state we’re already in.
And for 53% of the American people, it was apparently just good enough.


“And now the rest of the story”
Paul Harvey…
The headline number for the employment report was a little below expectations, but the upward revisions to previous months more than offset the disappointment. November was revised up from +161,000 to +247,000 jobs added, and December was revised up from +155,000 to +196,000. Over the last 3 months, the economy has averaged 200,000 jobs per month – and that was above expectations.
For manufacturing, the ISM index was solidly above expectations, and the underlying details were also positive. As an example, the new orders index was at 53.3%, up from 49.7% in December (above 50 is expansion). This was much better than the regional surveys indicated.
The change in total nonfarm payroll employment for November was revised from +161,000 to +247,000, and the change for December was revised from +155,000 to +196,000
[Benchmark revision:] The total nonfarm employment level for March 2012 was revised upward by 422,000 (424,000 on a not seasonally adjusted basis).
The private sector has done a remarkable job of maintaining its composure even while all around it, politicians are losing theirs. Hopefully that pattern will persist for the remainder of the year.
http://www.bls.gov/news.release/empsit.nr0.htm
Meanwhile, back in the land of truth.
According to the latest BLS report, average weekly hours worked continues to decline as the Obama Recovery© accelerates its dependence on low paying, part time and temporary jobs.
http://www.bls.gov/news.release/pdf/empsit.pdf
And now you have….the rest of the story.
The economy is in a persistent vegetative state, which is what happens when more than 50% of the voters are vegetables.
The reason that the economy is in a persistent vegetative state is because the president has no economic plan. It’s not keyensian economics, it’s not classical free-market economics. It’s robbing the treasury to funnel money to favored industries and constituencies, without regard to economic growth.
If it looks like it’s not meant to grow the economy, that’s because it’s not meant to grow the economy.
I just want to note that the plunge in workforce participation–and the recession–started when the gavels were presented to Pelosi and Reid in 2007.
The Baby Boomers start retiring en masse around 2015 or so at which time the labor force participation rate will improve although there will be fewer people actually working. Look for Candidate Hillary to trumpet President Obama’s success as proof the Republicans can’t be trusted with the economy.
Emery- Still fewer people working today than when Obama took office…..good day!
One good indicator of labor market improvement would be if we saw payroll employment increase by 200,000 each month for a number of months. We’ve been averaging about 150,000, but it’s been very uneven.
Turns out the average was a lot higher than the Fed thought. Could that signify we are closer to an end to quantitative easing than we thought?